Snap any chart.
Full read in 12 seconds.
Trend, levels, risk, and the reasoning behind every call. And when there’s no trade in the chart, it says so instead of inventing one.
Subscription. $7.99 a week or $39.99 a year. Cancel any time.
- ~12sFrom photo to finished read
- 9Sections in every read
- 47Academy terms, plainly written
- 0Of your journal on our servers
Three taps. About twelve seconds.
No ticker to type, no broker to connect, nothing to set up. If you can take a photo, you already know how to use it.
 Step 1
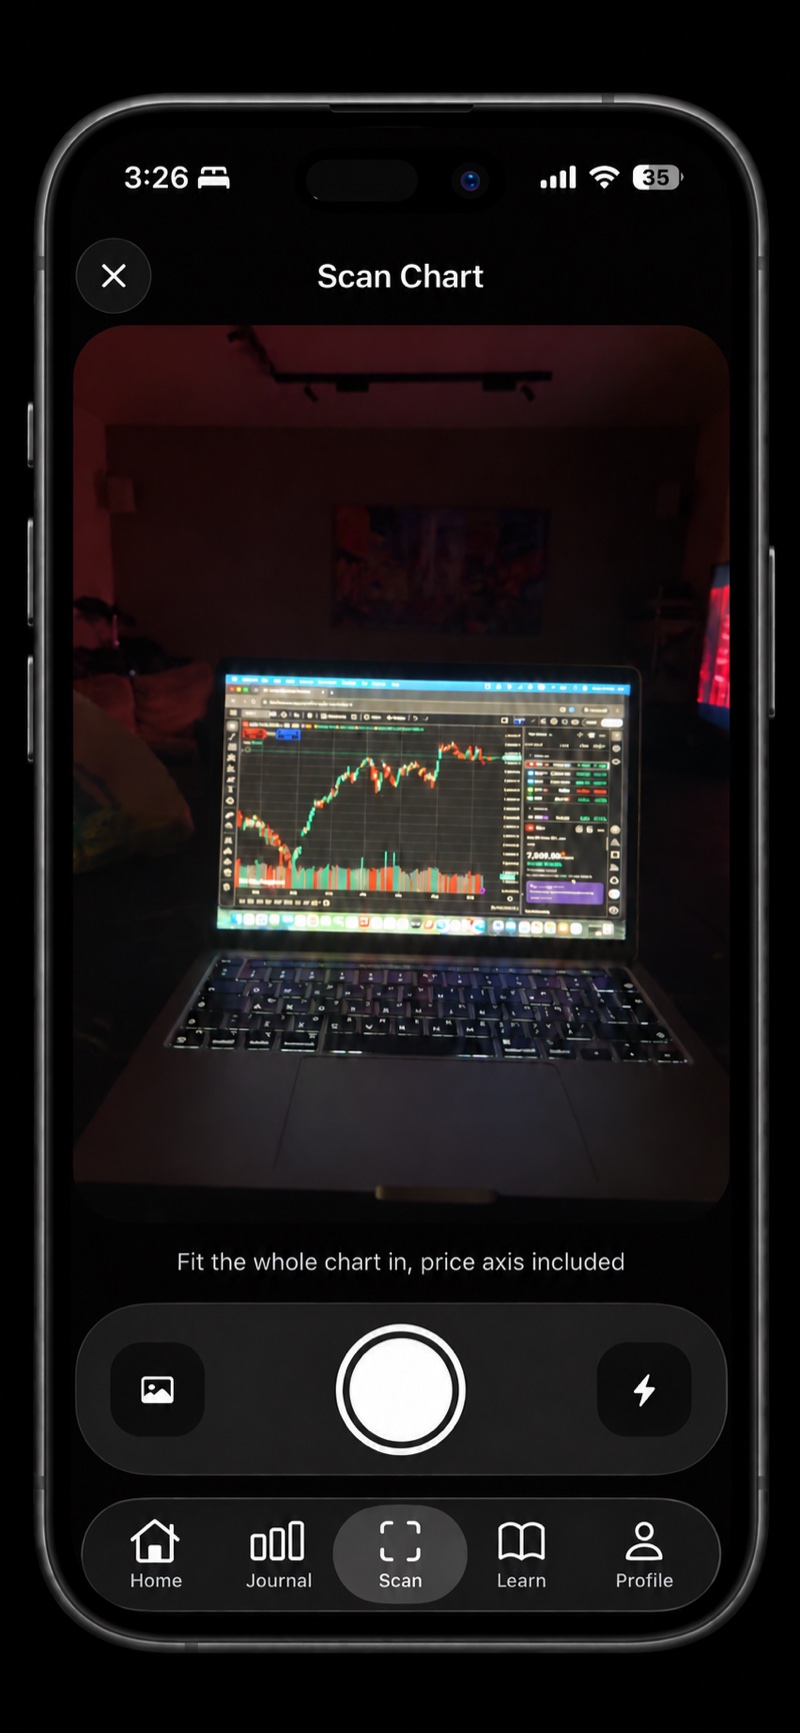
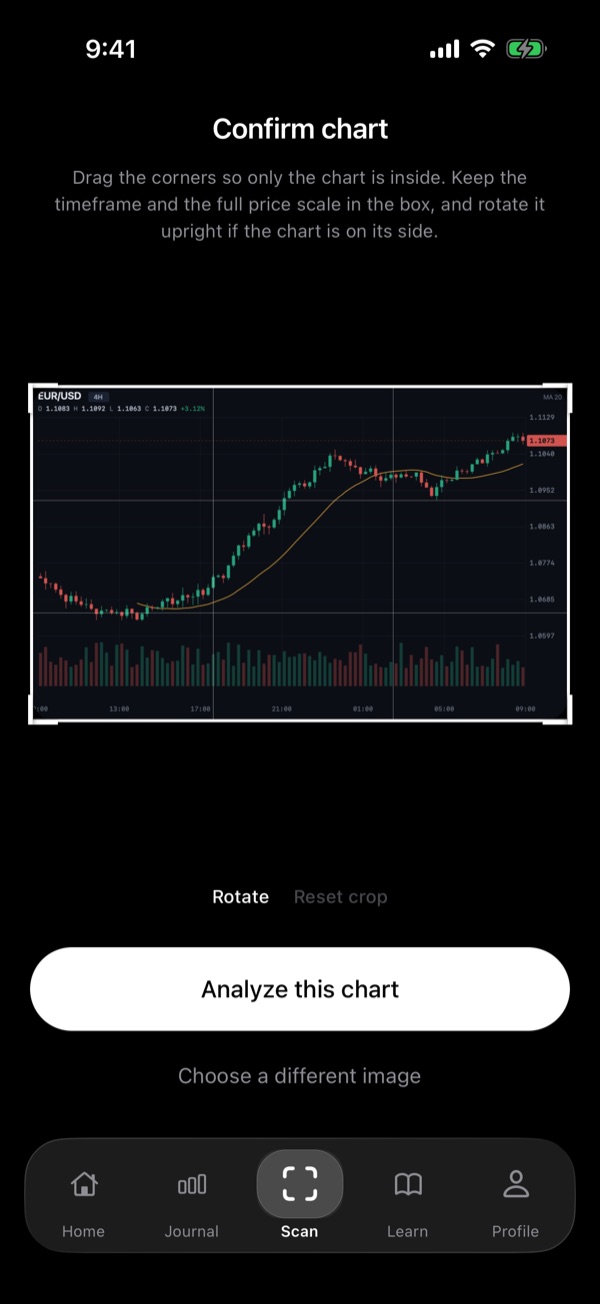
Snap it, or pick it
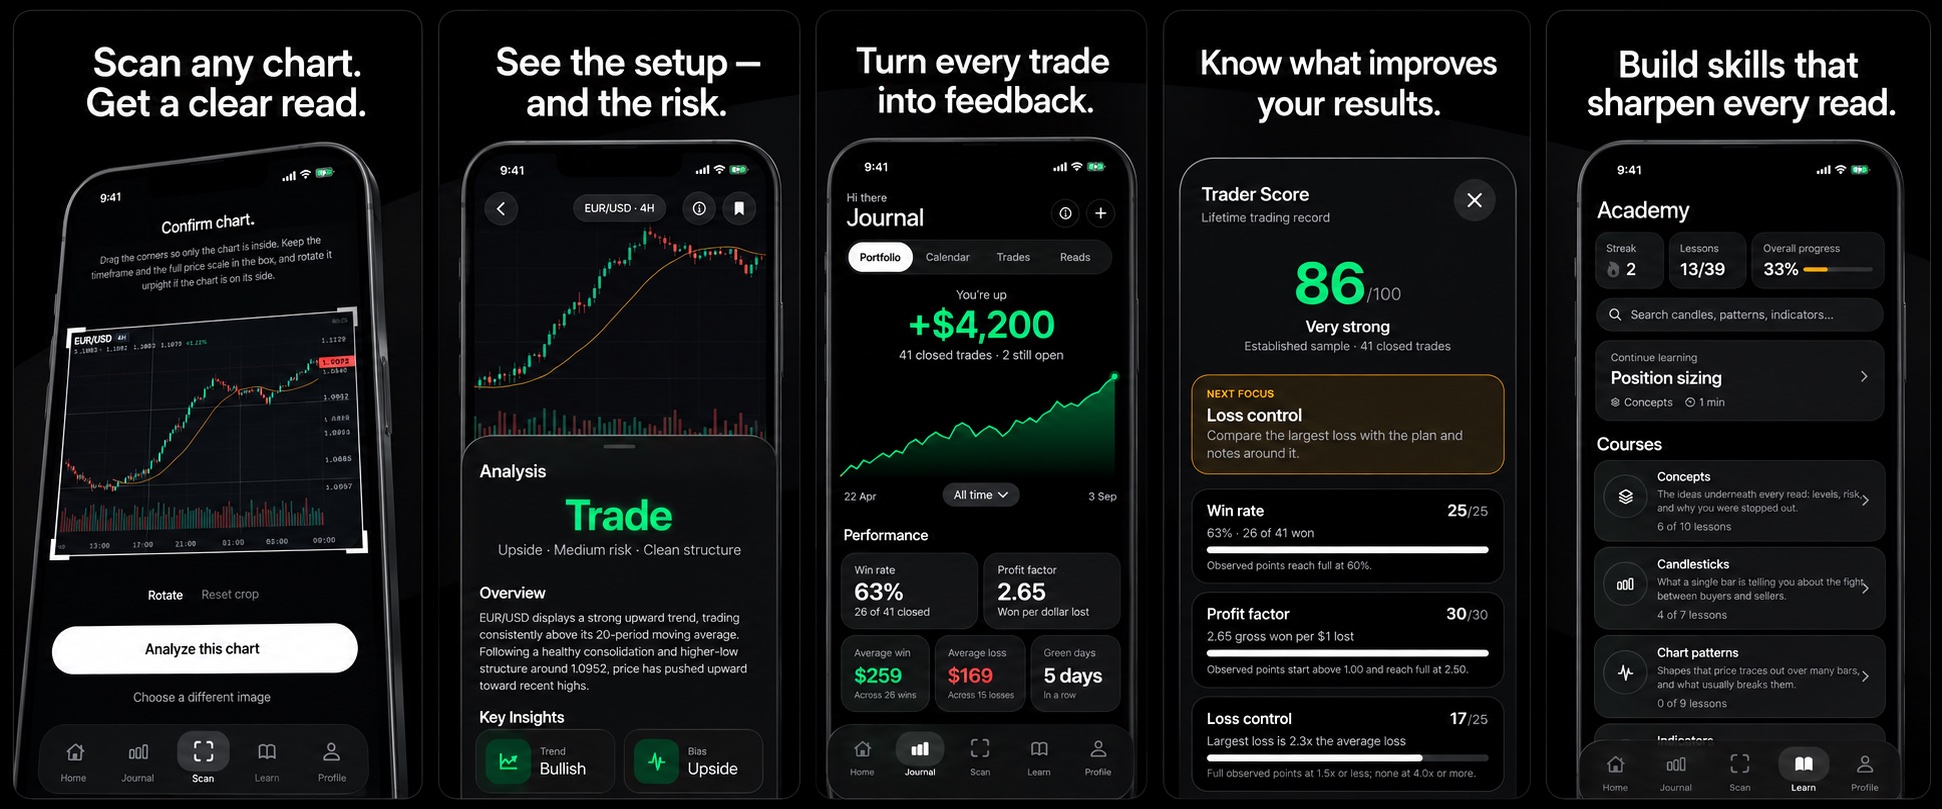
Point the camera at your screen, or pick a screenshot that’s already on your phone. Drag the corners so the whole chart is inside, price axis included.
- Step 2
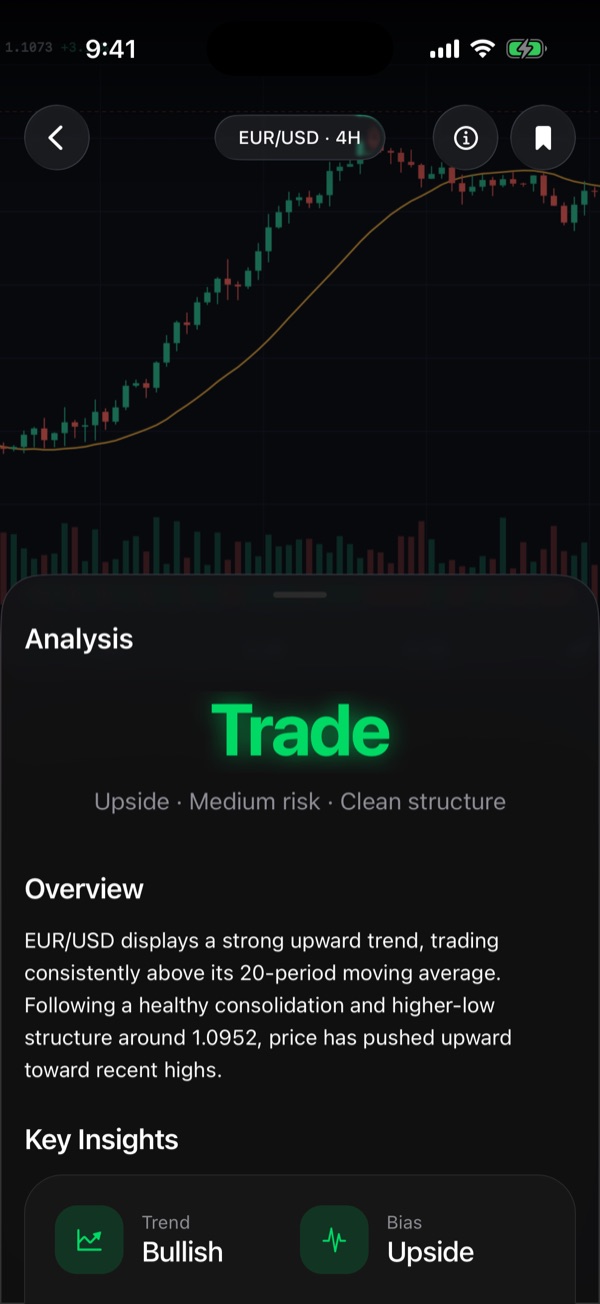
What comes back, every time
About twelve seconds later: the verdict, then trend, bias, levels, risk and why. Nine sections in the chart’s own numbers, the same nine every time.
 Step 3
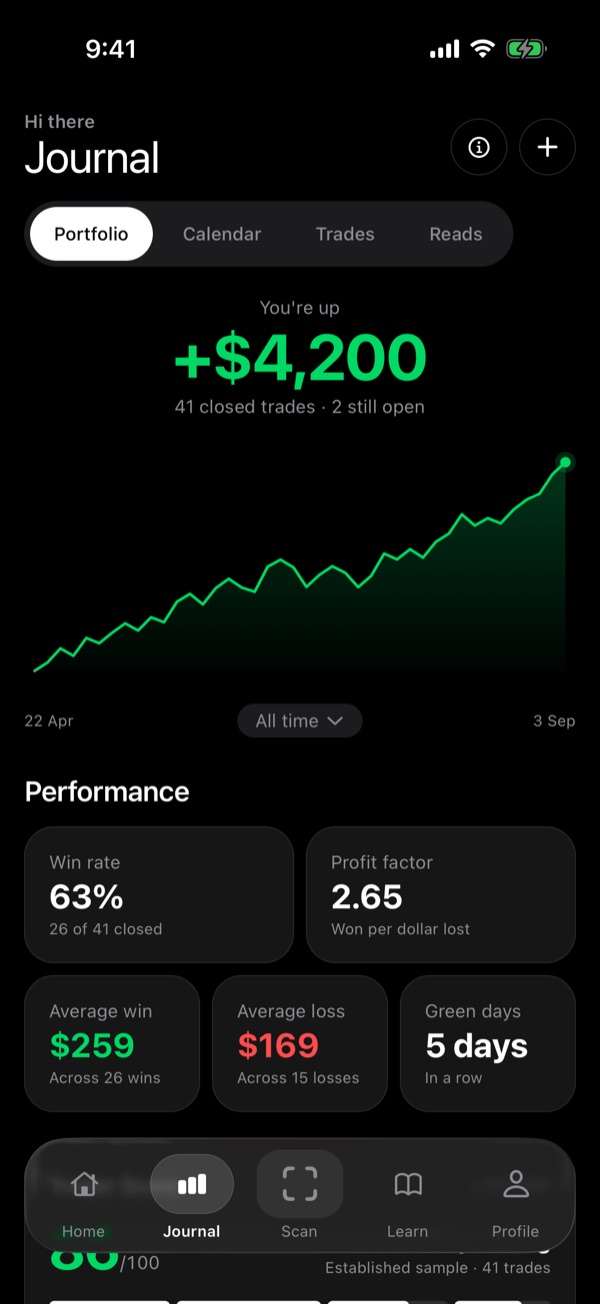
Keep the ones that matter
Save the read, log the trade you took, and let the journal turn a pile of decisions into a record you can learn from.
Five screens. One habit.
Scan, read, log, score, learn. Each one feeds the next, and none of them asks you to connect an account or type a ticker.
One photo.
A complete chart breakdown.
Point it at your broker app, a TradingView tab, or a screenshot that’s been sitting in your camera roll for a week. Back comes the verdict, then trend, bias, levels, risk and the reasoning. Same nine sections every time, so two reads are worth comparing.
- Trend and bias
- Support and resistance
- Entry, exit and risk
- Patterns and indicators
Not every chart needs a trade
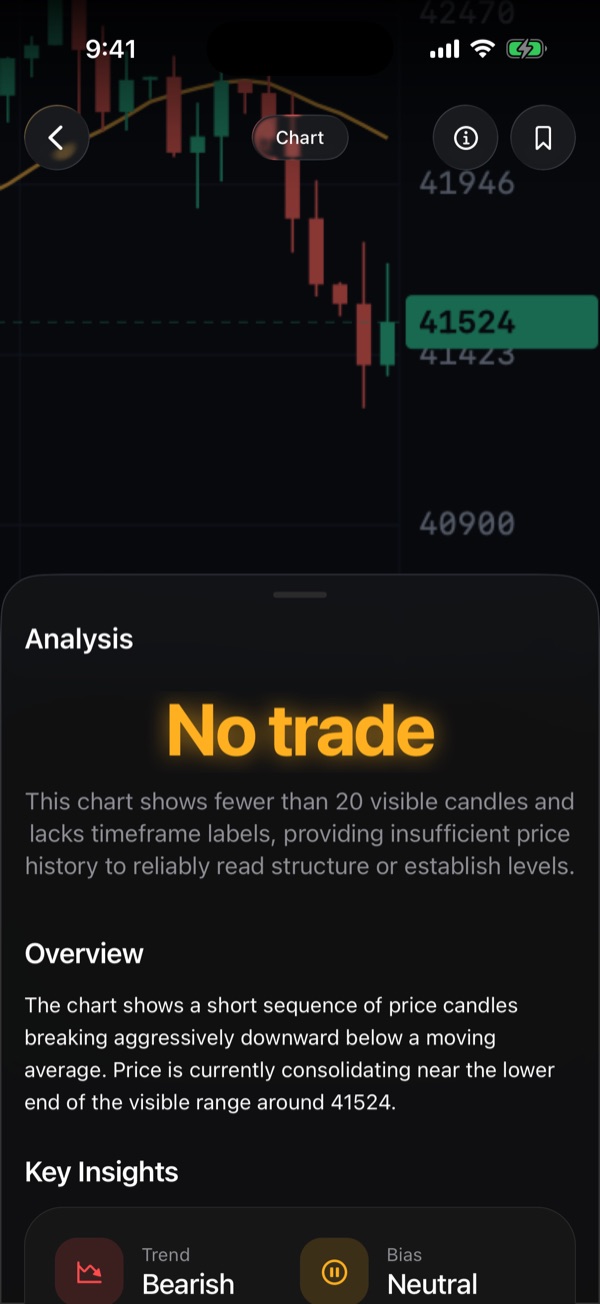
A good setup can still become a bad trade. ChartPeak checks the evidence before pressure changes the plan. So every read carries its risk level and what would prove it wrong — and when a chart is range-bound, mid-move, or simply too new to say anything about, you get a no-trade and a plain reason why. Twenty candles and no timeframe label gets called twenty candles, not a target.
- The verdict comes first
- Risk named on every read
- Thin history gets flagged
- It says what would change its mind
Turn every trade
into feedback.
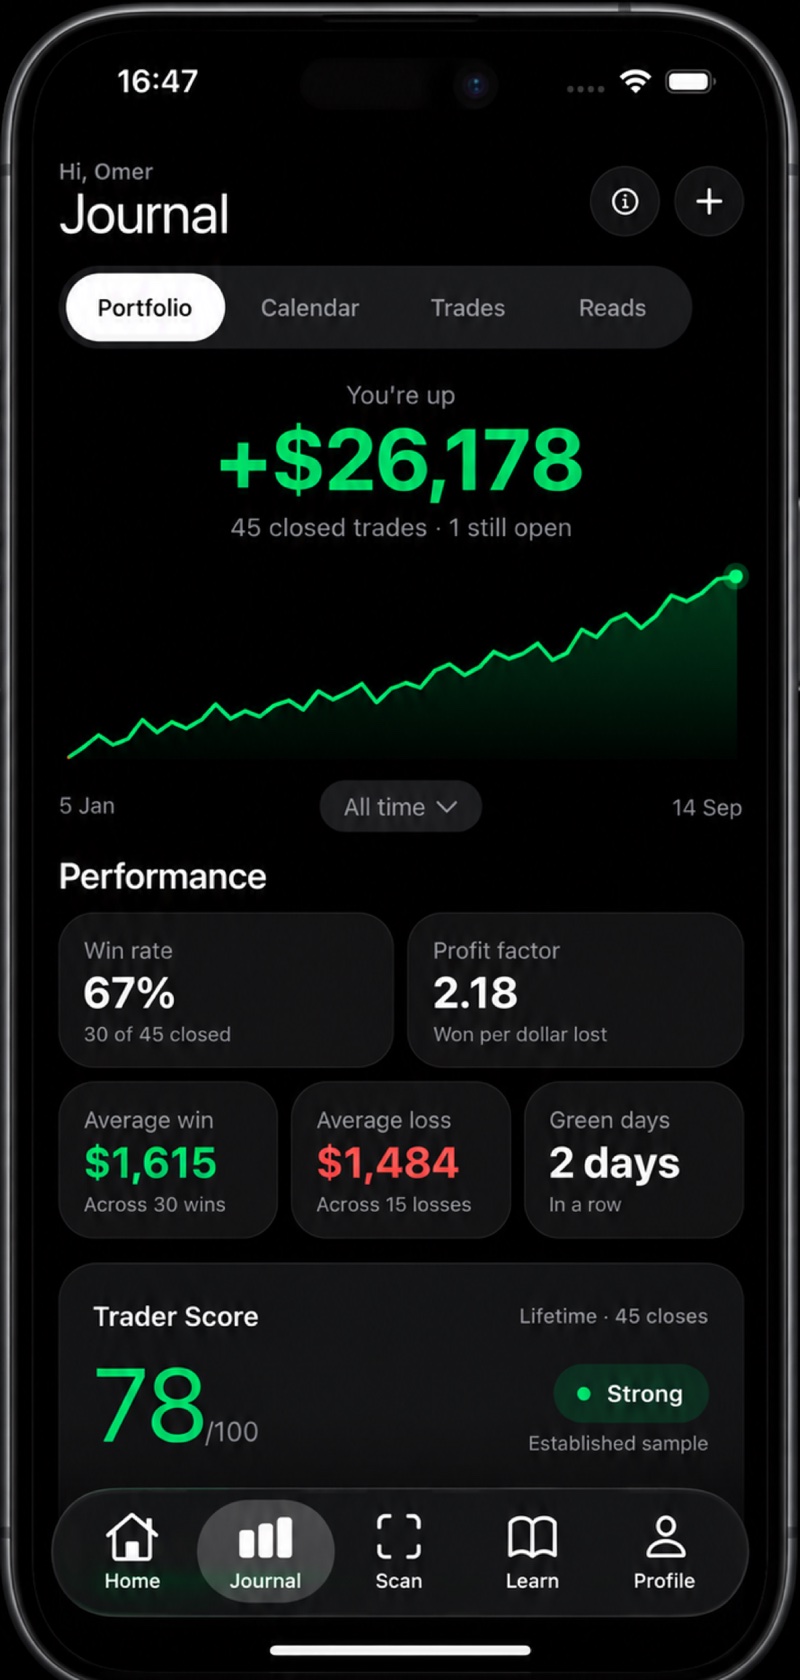
Log what you took and how it went. The equity curve, the P/L calendar and every figure on the screen recompute from rows you can open and check. It’s your record, typed by you, so nothing here asks to be taken on trust.
- An equity curve you can scrub
- P/L by day, on a calendar
- Wins, losses and still open
- Saved reads alongside
Know what improves
your results.
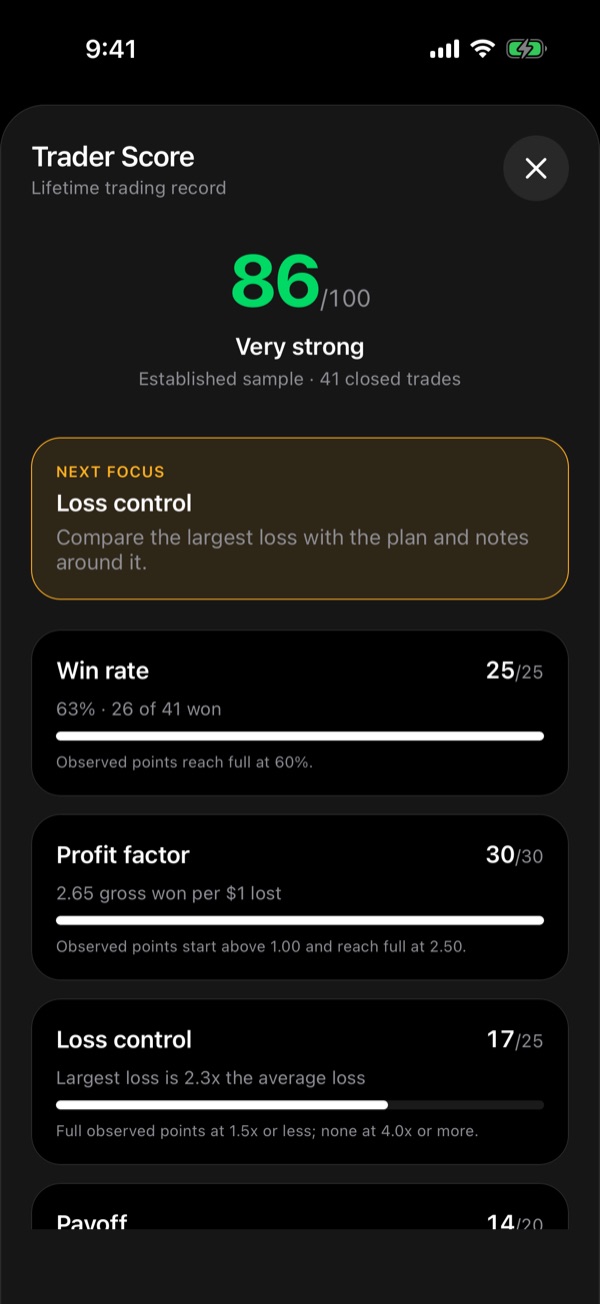
One number out of 100, built from four things your closed trades already say: win rate, profit factor, loss control and payoff. It stays quiet until you’ve closed ten. After that it names whichever of the four is dragging, so the next thing to work on is never a guess.
- Win rate, 25 points
- Profit factor, 30 points
- Loss control, 25 points
- Payoff, 20 points
Practice reading charts
before you trade
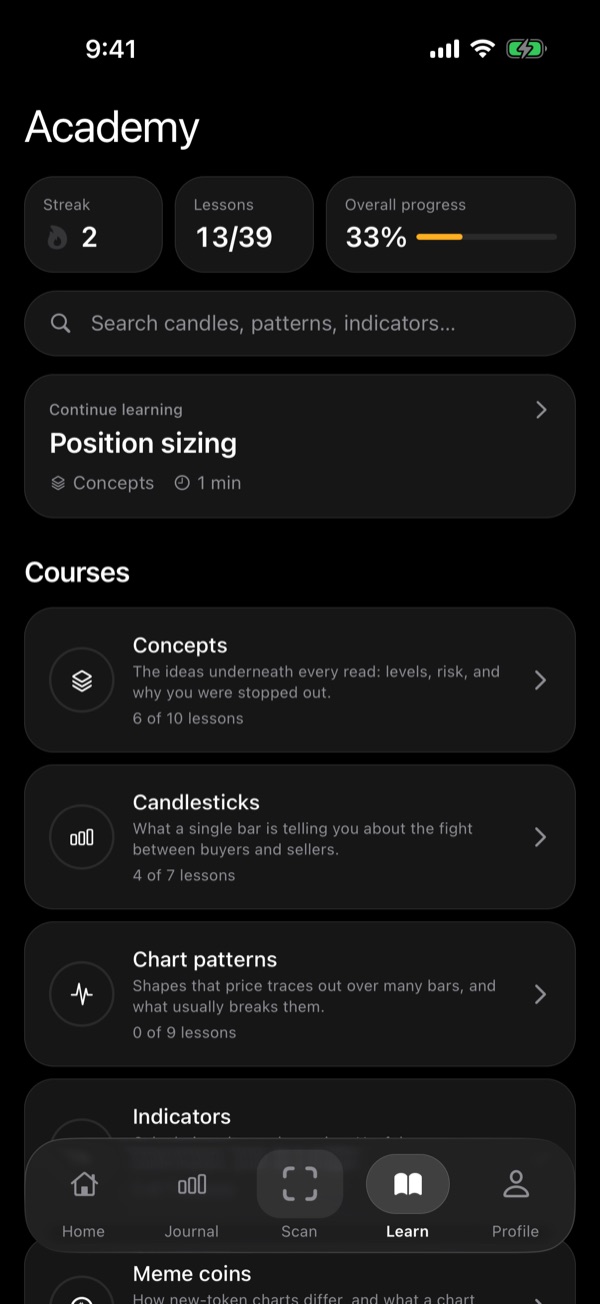
47 terms, each written for the moment you actually run into one, and each honest about what it gets wrong. RSI can sit above 70 for weeks in a strong trend. Chart puzzles make you call the level yourself before showing you the answer.
- 47 terms, plainly written
- What each one misleads about
- Chart puzzles to practise on
- Progress that tracks reading
Your journal never
leaves your phone.
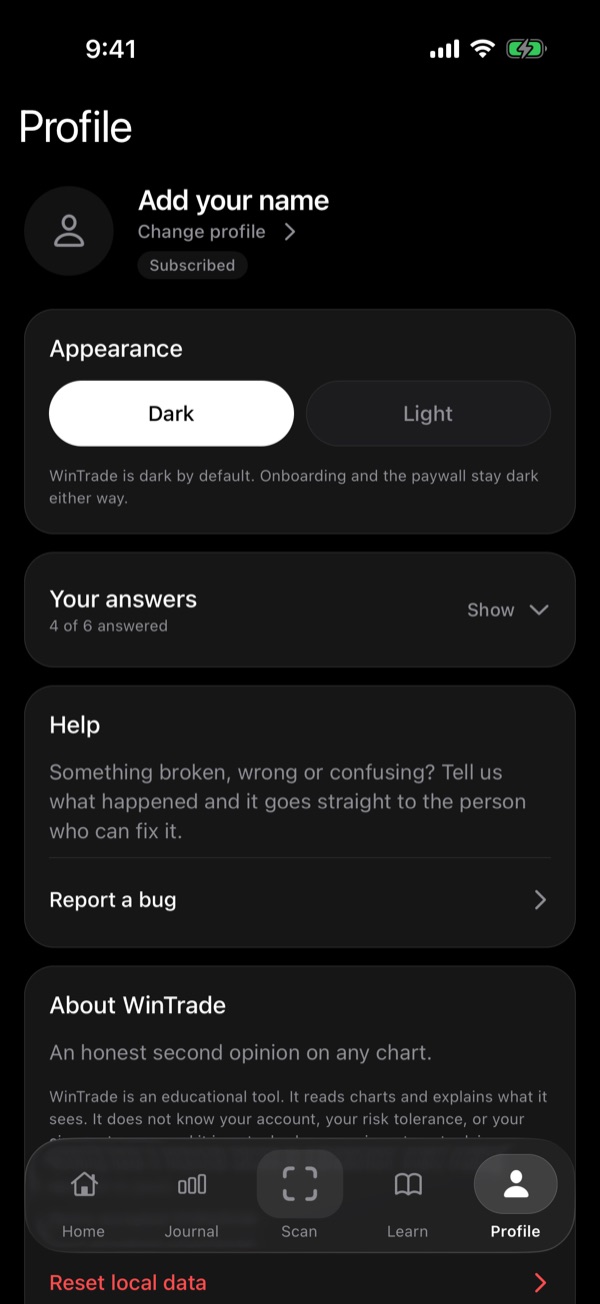
Trades, saved reads, the answers you gave at setup: all of it lives in a database on the device, and none of it syncs. Your account on our side holds a name, an email and a scan counter. The one picture that leaves is the chart you photograph, and only so it can be read.
- No cloud copy of your journal
- Only the chart image is sent
- No broker link, no price feed
- Delete the account, delete the data
One product. Two ways to pay for it.
Every read costs us a call to a paid model, so there is no free tier. Here is the whole price list, so you can decide before you install.
Try it for a week of real charts. Renews weekly until you cancel.
About 90% less than a year of weekly. Renews yearly until you cancel.
- Unlimited saved reads and journal entries
- Up to 60 chart reads a day
- The no-trade call, on every chart that earns it
- Trader Score, calendar and equity curve
- The full Academy, puzzles included
- Cancel any time from your Apple ID
Prices in US dollars; your store shows the local equivalent. Payment is charged to your Apple ID at confirmation and the subscription renews automatically unless cancelled at least 24 hours before the period ends. See the terms, refund policy and fair use limits.
Three things worth knowing first
Better to find out now than after you have paid.
- How accurate is it?
- It’s a language model reading an image, and it can be wrong. It can misread a crowded chart, miss a level, or name a pattern that isn’t there. Treat a read as a second opinion to check your own against, never as the deciding vote. That’s why the disclaimer sits on every read instead of being buried in a settings screen.
- Does it connect to my broker?
- No. There is no broker connection, no account sync and no CSV import. Every trade in your journal is one you typed in yourself, which is why the app calls them trades you logged rather than positions. If you want something that reconciles against a live account, this isn’t it.
- What does it cost?
- Two plans: $7.99 a week, or $39.99 a year, which works out about 90% less than a year of weekly. Both are auto-renewing subscriptions through the App Store. Cancel any time and you keep access to the end of the period you paid for.
Read the chart
before you trade it.
A straight second opinion on any chart, about twelve seconds after you take the picture. Including the times the answer is “not this one”.